
20 Social Media Holidays to Celebrate This May
By Yasmin PierreApr 10
Unlock the secrets to staying ahead in the ever-evolving world of social media marketing.
Published March 7th 2019
Reporting can be repetitive, stressful, and often bloody boring.
Lucky for the marketing team at Brandwatch, we’re able to use Vizia. It’s a tool that’s got multiple features aimed at bringing more joy to the task of sharing performance data with our colleagues.
Previously, the wider marketing team would receive a weekly email from the marketing operations team. It consisted of a large Google Sheet full of numbers and color coding detailing the performance of particular content pieces and results across different regions. If we’re honest, not many people spent the time trying to decipher it’s meaning.
It was a clear example of something that could be communicated more smoothly, but finding a tool that got the right information across and that didn’t make things more complicated was not easy.
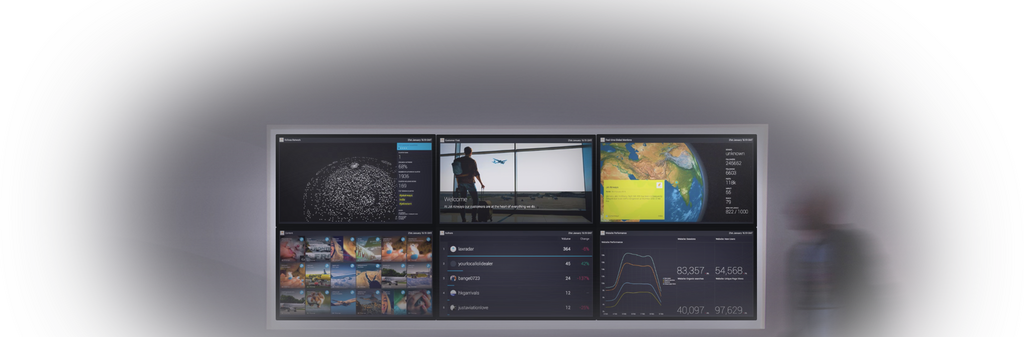
Vizia has been a tool that’s been around for a while, and it’s able to show a plethora of business data beautifully for distribution across screens in a single office, or screens in offices and lobbies and events worldwide.
Recent feature updates mean that individuals can use the tool to create beautiful reports, integrating data from Salesforce, Google Analytics, Google Sheets and more, and distribute them via email to their colleagues. Those doing the reporting can then see who’s opened those reports, what they liked the most, and make improvements accordingly.
Since the marketing operations team switched to using Vizia for their reporting, their team and the team at large has experienced a whole bunch of benefits.
I spoke with Lauren Corre who is responsible for pulling together reports in Vizia and distributing them among the marketing team. Here are the benefits she told me about.
“We provide reporting weekly, monthly, quarterly, and yearly,” Lauren says. “It was a very manual process and our weekly updates specifically didn’t seem to be engaging anyone.”
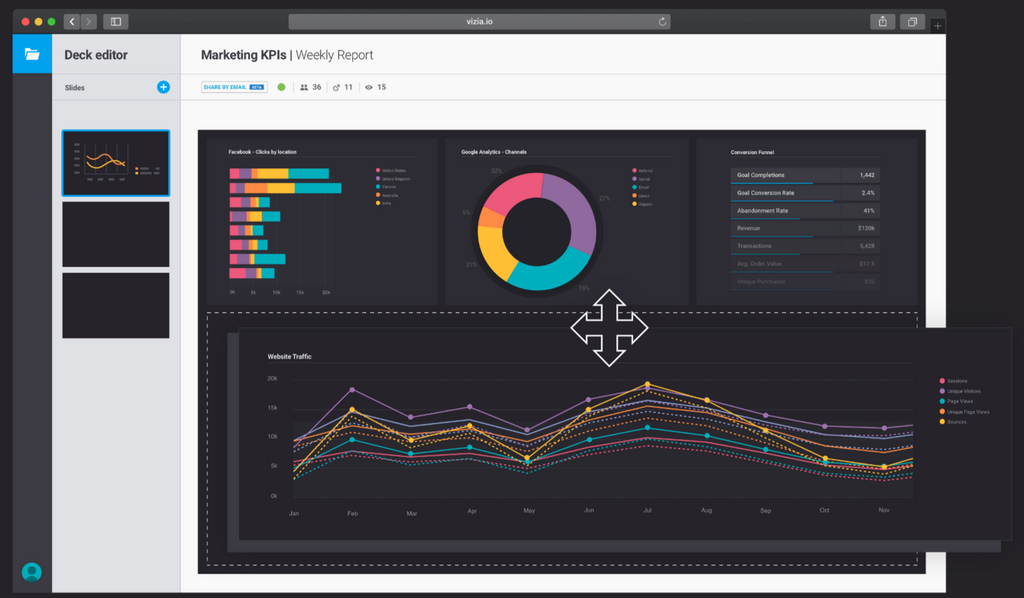
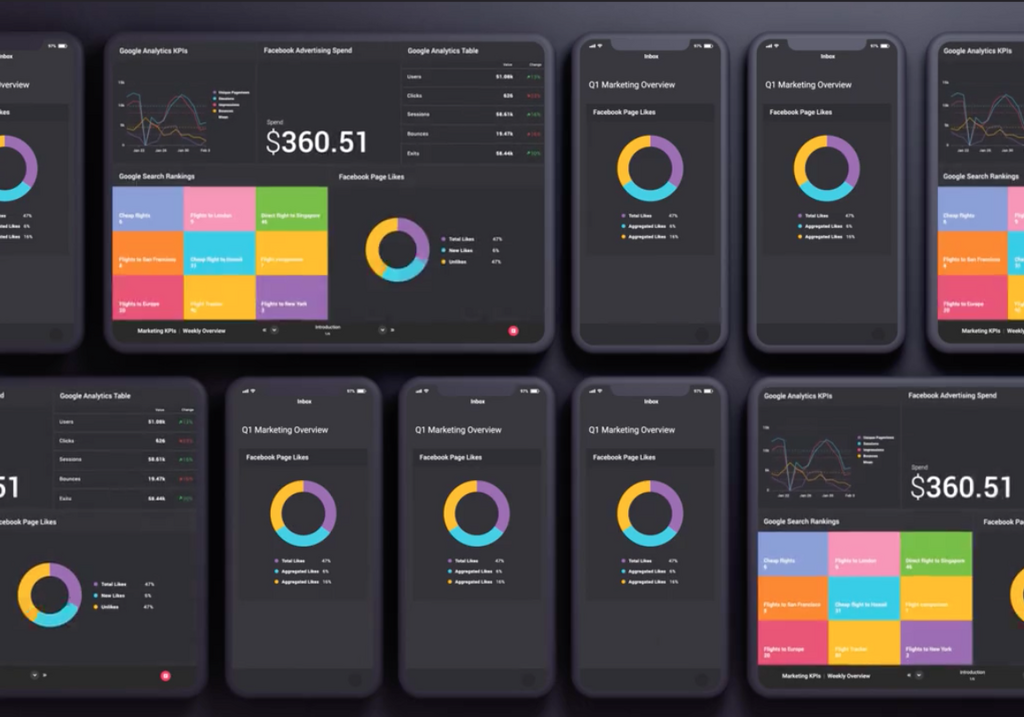
What was once a seemingly endless spreadsheet that made it difficult to know what was important is now 18 slides, broken out by region, that show how everything is performing. Neat annotations show exactly what the numbers mean and provide context around the graphs, and the whole thing is available to view on laptop, big screen or mobile.
Overall the user experience has seen more people interact with the numbers, ask questions, and point out when things don’t look quite right.
“It allows our colleagues to skim through marketing performance numbers globally and check if we’re on target.”
“We now spend less time reporting, but we’re still informing the team week-to-week,” Lauren says.
In fact, using Vizia has reduced the time she spends on weekly reports drastically.
“It doesn’t take a whole morning anymore.”
With the system taking over the business of pulling in numbers and displaying them, Lauren can focus on contextualizing it.
Once the charts are in place, Lauren will take a look at the data, examine anything unexpected and add context as notes for the team to help them interpret the data and what the action points should be.
“It’s a lot easier. I have a lot more time because the graphs are already updated and I just have to look at the reasons behind the changes.”
It feels like a futuristic blend of human and machine-based intelligence.
Other members of the team behind this Vizia deck have gone a step further: “My colleague Matt has fully automated the reporting that he adds to the deck,” Lauren explains. “It’s interesting to see how we’ve approached it differently.”
While Matt focuses primarily on conversion numbers and other Google Analytics data that’s pulled in and contextualized week-on-week, showing the team trends pointing upwards or downwards.
Because everyone knows that their readings are being counted, it’s meant we’re all a little more mindful of the stats – it’s kept us all accountable.
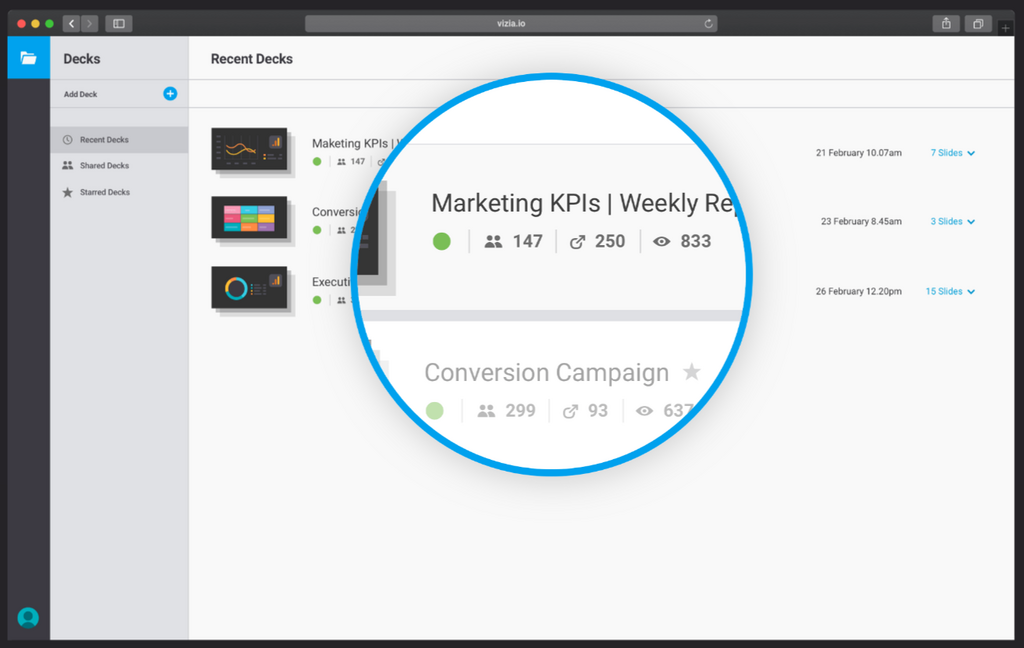
Vizia also gives a lot more feedback to the reporter than before – it has functionality that allows Lauren to see who’s read the report, and the top slides in the deck.
This gives her the power to call people out for not reading things that are important to them (and I’ve seen her do it). It also means she can keep an eye on which slides are more or less interesting than others, signs of things that can be improved.
The marketing ops team’s use of Vizia has inspired others to change the way they report. Now when I’m reporting on Brandwatch blog performance numbers to my boss I’ll immediately share Vizia screens instead of Google Slides or Google Sheets which were my previous tool of choice.
Meanwhile, having access to slides like these with live data being fed in means that anytime someone has a question about the current numbers it’s as simple as sharing a deck – not scrambling around spreadsheets for answers.
Reporting is boring and reporting is time consuming – it’s rare that it’ll spark any joy. A new tool has changed the way our team does it – could it help yours?
Get in touch to find out more.
Offering up analysis and data on everything from the events of the day to the latest consumer trends. Subscribe to keep your finger on the world’s pulse.
Bring your social and marketing insights to life across your organization.
Existing customer?Log in to access your existing Falcon products and data via the login menu on the top right of the page.New customer?You'll find the former Falcon products under 'Social Media Management' if you go to 'Our Suite' in the navigation.
Brandwatch acquired Paladin in March 2022. It's now called Influence, which is part of Brandwatch's Social Media Management solution.Want to access your Paladin account?Use the login menu at the top right corner.