Our clients want comprehensive coverage of the conversations going on about their brand online.
They want to be able to monitor globally, and they want a platform that lets them do this quickly and easily.
But what our clients really need are intelligent insights that inform real decisions across their business.
This month we’re adding a rich new source of discussions and opinions with Disqus data, have extended our coverage to more languages than ever, and released several new features that bring actionable insights to the forefront of the Brandwatch platform.
Every month, over 20 million comments are posted on articles and blogs (including this one) using Disqus, which are read by over 3 billion people.
Tapping into this new data source can reveal a lot about what people really think about the topics, stories, brands and products they’re reading about online. The comments section is often where the most honest, impassioned and opinionated discussions take place.

Disqus comments on review sites or on a brand’s own website are where consumers offer their most immediate reactions to new product launches and services. This allows marketers to discover what’s being said about their brand before it reaches social media.
It’s also an extremely powerful place for PR teams to read the real response to news stories about their organization. The sentiment of the article may not match the public opinion and this added layer of detail can inform public responses and campaigns.
Expand and improve your global monitoring with even more language improvements
As a global business ourselves, we understand the need for our growing client base to reach more markets and collaborate with more international teams across the world.
In August we added support for 16 new languages, and this month we’ve also added support for Catalan. This takes us to 44 supported languages, allowing our users to track even more of the globe.
On top of that, we’ve made some improvements to our language classifiers to increase accuracy and ensure our clients are getting the most relevant, useful data possible.
Filter faster with Tab-wide filtering
With all this new data, our Queries are pulling in a huge amount of information. Getting to the insights within is what Brandwatch does best.
We’ve made our Dashboards even more powerful by introducing Tab-wide filters, allowing users to apply their filters to all components in a Dashboard Tab at one time.

This transforms the user experience, letting users turn an entire page of information about their brand into a targeted analysis of a particular segment or demographic in seconds.
By copying a useful Tab it is possible to create multiple views looking at each of the segments you are interested in. Or you could analyze mentions about individual products alongside each other.
Understanding what different genders or people from different locations are saying about a brand can help you develop campaigns and strategies that are optimized for each group.
Understand what’s driving social trends
Seeing peaks in social data is great, but what exactly is driving those trends?
Now users of our Vizia command centre can glean a deeper understanding with Vizia Explain, which automatically shows the specific topics that have caused people to start talking about their brand or event.
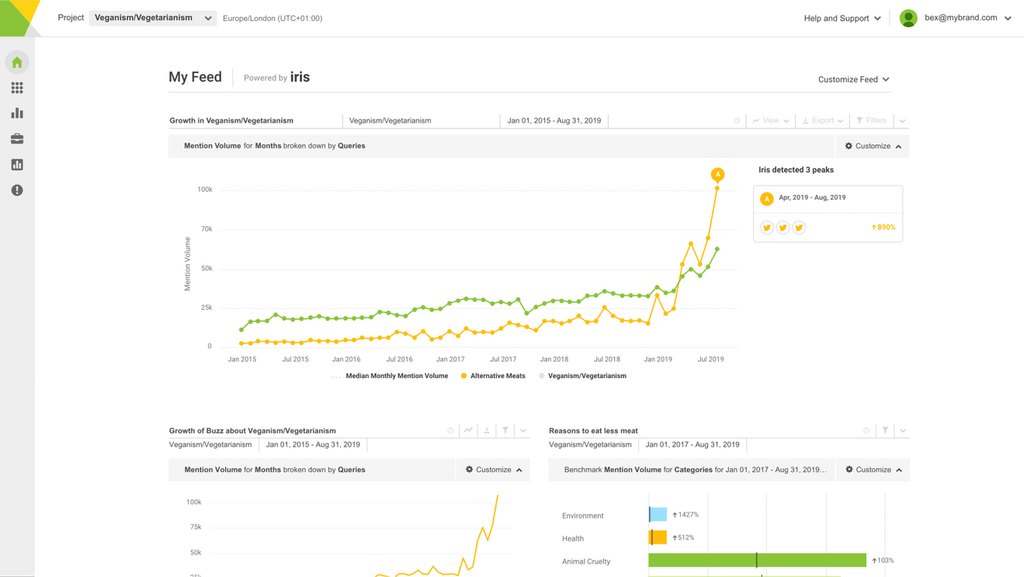
It uses automated intelligence to identify the peaks in conversation and then display the topics driving them.

Vizia Explain gives teams across the organization the full story by putting their social data into context.
This month also saw the launch of two big new features that help our users unpack the true value of the Brandwatch platform much faster.
Visit the Brandwatch Community Forum where hundreds of your peers are already signed up and sharing their success stories and swapping ideas. You can also ask our product teams anything about these updates or offer your suggestions for what should come next.
And all users now have access to the data and Dashboards behind some of our experts’ top research at Insights Central. See what a complex polished Project looks like, and find inspiration to start developing your own.
For more details on any of our updates you can take a look at September’s ‘What’s Next?’ guide or get in touch with us to find out more.


