Your field guide to navigating the social media wilderness - powered by 18M+ data points and expertise from 1,000+ marketers.
Brandwatch and Ditch The Label joined forces to analyze 19 million tweets over a four-year period to explore the current climate of cyberbullying and hate speech online.
For the first time, we used social data from Twitter to measure rates of online cyberbullying and hate speech. Our previous research showed that 3 out of 5 young people experience cyberbullying at some point.
Please note that in places the data presented in this infographic is uncensored. We recommend getting parental advice before exploring this infographic if you’re younger than 16.
The Internet is a powerful tool for connecting communities and people. However, this connectedness also makes it possible for people to attack each other without meeting, even from across the planet.
This infographic explores online abuse from across the UK and USA, but we acknowledge that bullying is a global problem. This report provides just a fraction of an insight into a wider, growing issue.
The data points shown in the map represent 3% of the body of hate speech and bullying dialogue captured by Brandwatch in the USA and UK.
Low CPU mode enabled
By tracking the context and frequency of abusive terms used we obtained an accurate picture of abuse, while also accounting for culturally reclaimed words. This data may enable DTL to better target interventions.
Cyberbullying is classified as generalized abuse, largely towards the appearance, interests, intelligence or previous posts of the recipient. Cyberbullying is not a separate issue from traditional bullying; rather an expansion of the platforms on which it exists.
Hate speech is differentiated from cyberbullying in being defined as abuse directed specifically toward a unique, non-controllable attribute of a group of people.
Each week, Ditch The Label helps thousands of young people overcome bullying through the pioneering support services available freely on DitchTheLabel.org. Understanding how abuse volume varies over time helps us tailor support services and campaigns to match demand.
Social data is observational and objective – allowing a scientific and targeted approach to providing cutting-edge advice and support, and helping us to counteract the damage of online abuse.
Discussion of certain topics was much more likely to attract abuse – most notably politics, sports,food and music. However, the data shows bullying occurs in response to a wide range of conversation subjects, showing that it is not limited to one or two niche interest groups. This data suggests a need for stronger tolerance and respect for the preferences of others.
While some divisive topics such as politics emerged, overall we found a broad range of topics preceded bullying. There is no simple cue found to trigger trolling on Twitter.
To conclude the section on cyberbullying, we explored the relative frequency of outcomes experienced by recipients who respond to their aggressors. The data shows that it really is true: responding to abuse can often only embolden the attacker.
As one of the world’s largest anti-bullying charities, we’re here for you. Getting instant advice and support is just a click away.
In the following sections, we will explore the phenomenon of racism, homophobia, and transphobia on Twitter, including data on how it has evolved over time and the authors who are generating it. This data will help us create and target new awareness campaigns, and will feed into the support that we provide.
For the purpose of this research, hate speech is defined as abuse that directly targets a unique factor beyond the control of the recipient. We recognize that there is a broad spectrum of hate speech; in this research we focus on race, sexuality and gender identity.
Hate speech is differentiated from cyberbullying in being defined as abuse directed specifically toward a unique, non-controllable attribute of a group of people.
According to our data, racism is the most prevalent form of hate speech on Twitter – far surpassing homophobia and transphobia. Over time, discussions of all types of hate speech have increased, suggesting an encouraging increase in awareness of these issues.
Note: This study measures explicit prejudiced language. Be aware that not all prejudice is explicit (for example, derogatory but non-gendered comments about trans people) and this may impact some category volumes more than others. Detecting implicit bias online is therefore an important avenue for further research.
Four years of data has enabled us to track the volume of hate speech on twitter alongside the rate of discussion of those same issues, over a long time period. Discussion has increased greatly over the time frame, while the growth in abuse varied between types.
We plotted this data against real life events such as Brexit and the US elections to consider what influence they may have had upon rates of racist, homophobic and transphobic tweeting.
We explored the professions and interests of users most likely to perpetrate hate speech. By understanding authors, we are able to delve deeper into their psychology and motivations to tailor campaign materials and help prevent the issues.
We recognize the huge volume of data regarding authors of hate speech posted on the Twitter platform. Not everybody from a specific profession or with a certain interest is using the platform to be abusive, but this helps us identify groups with higher levels of perpetration.
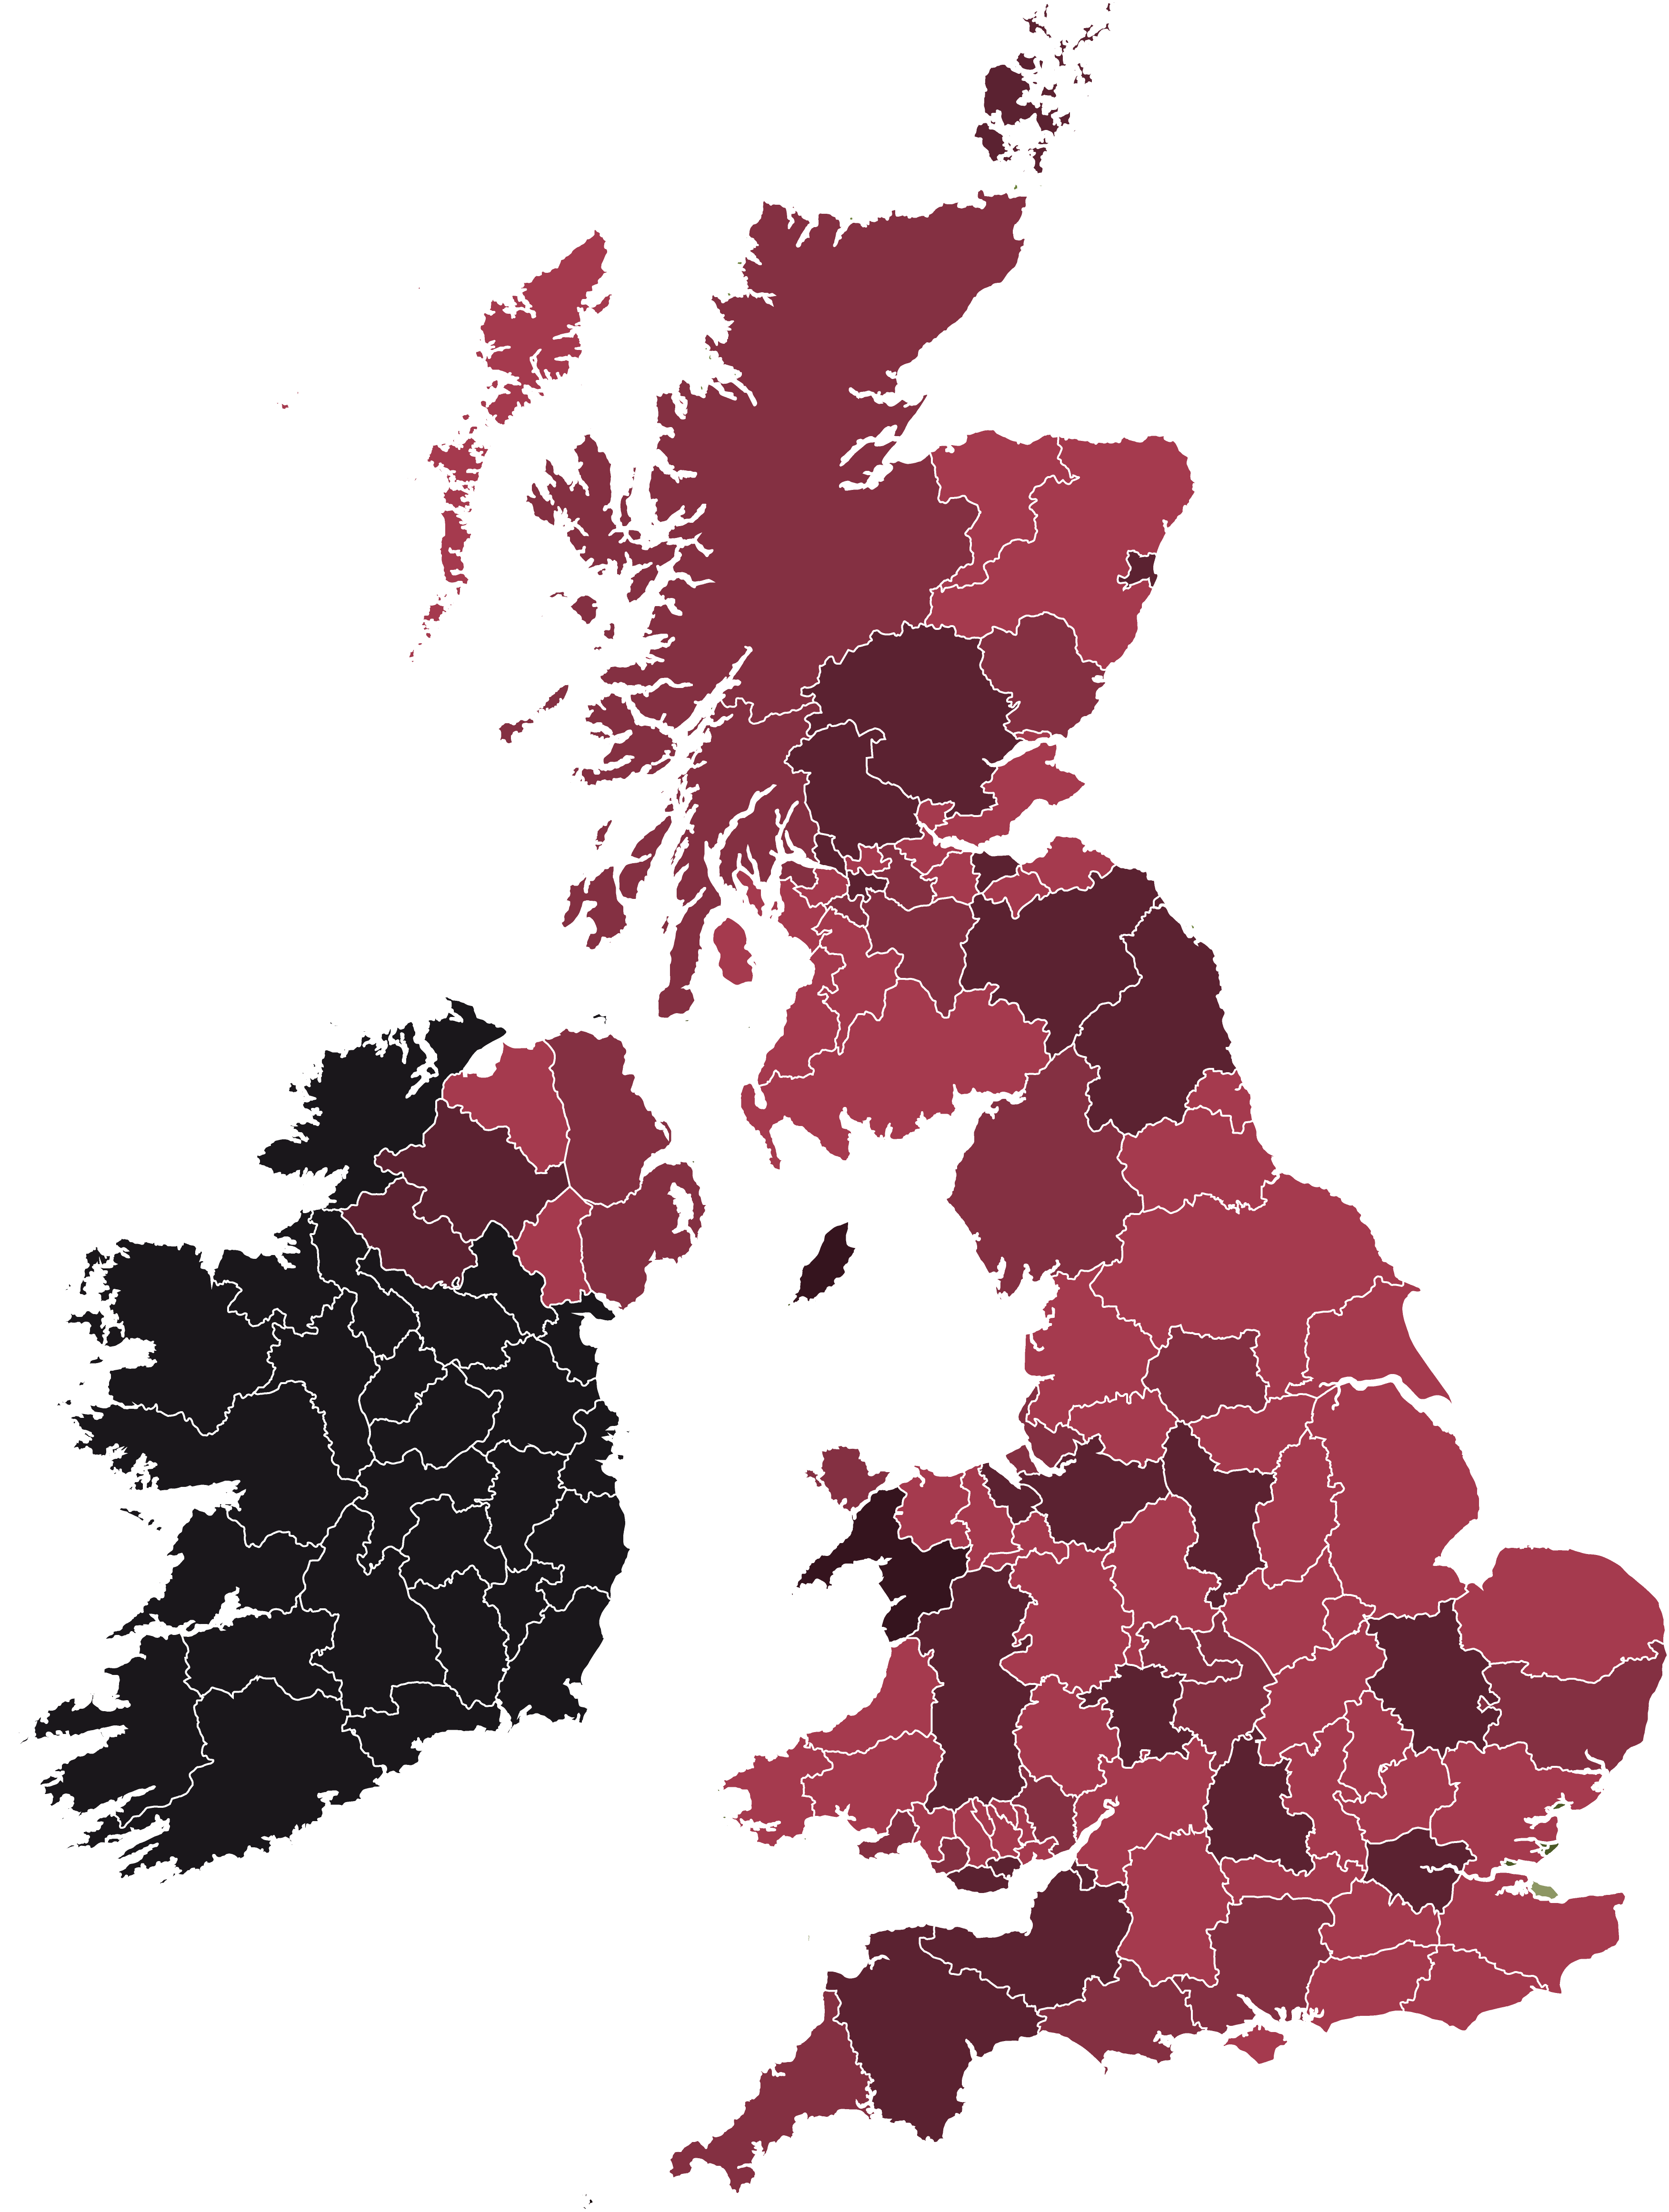
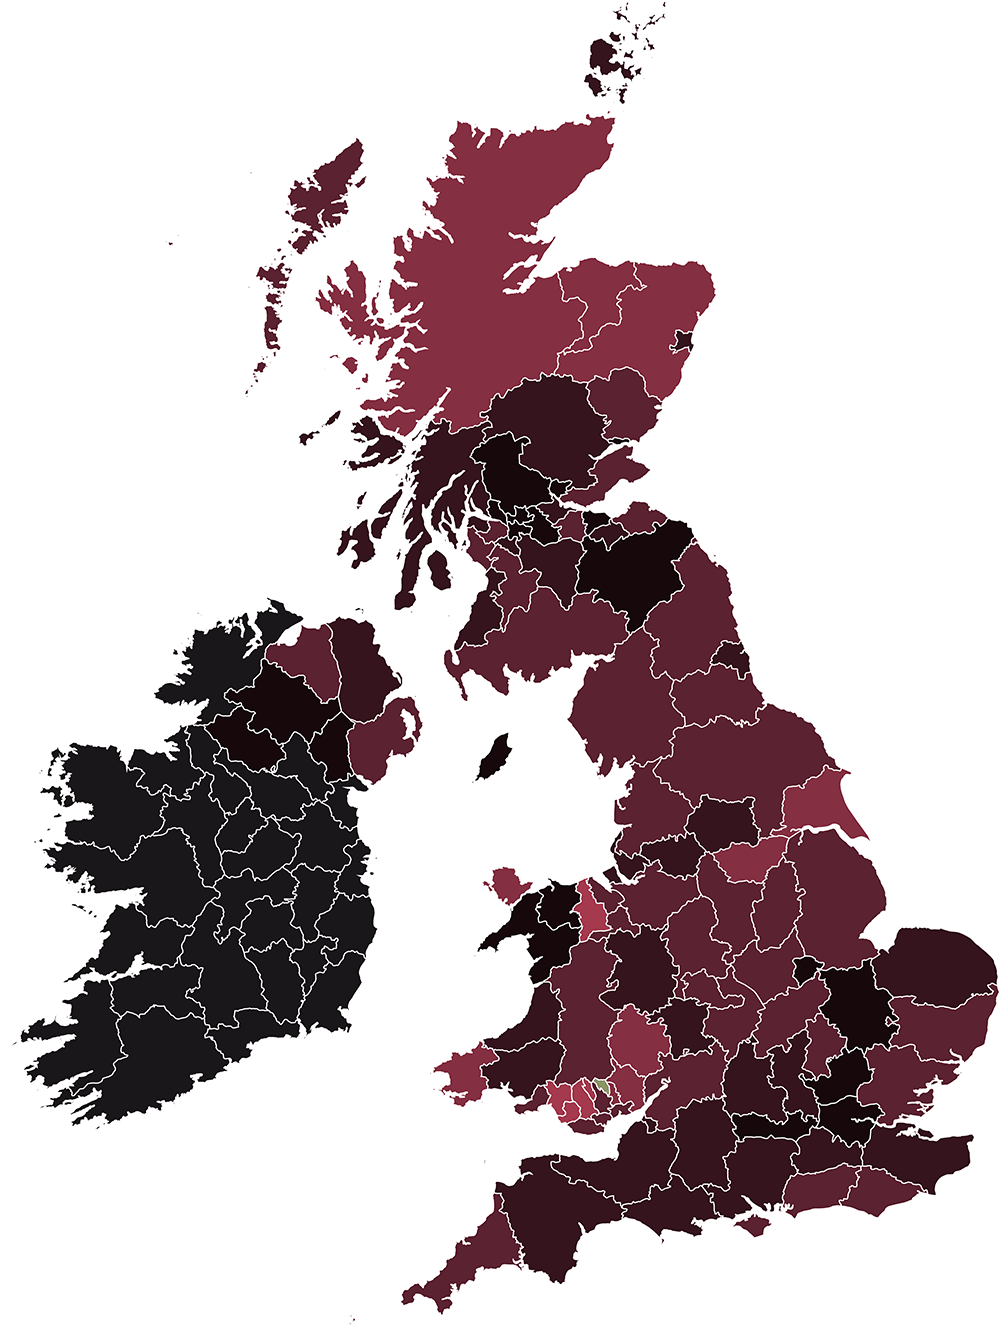
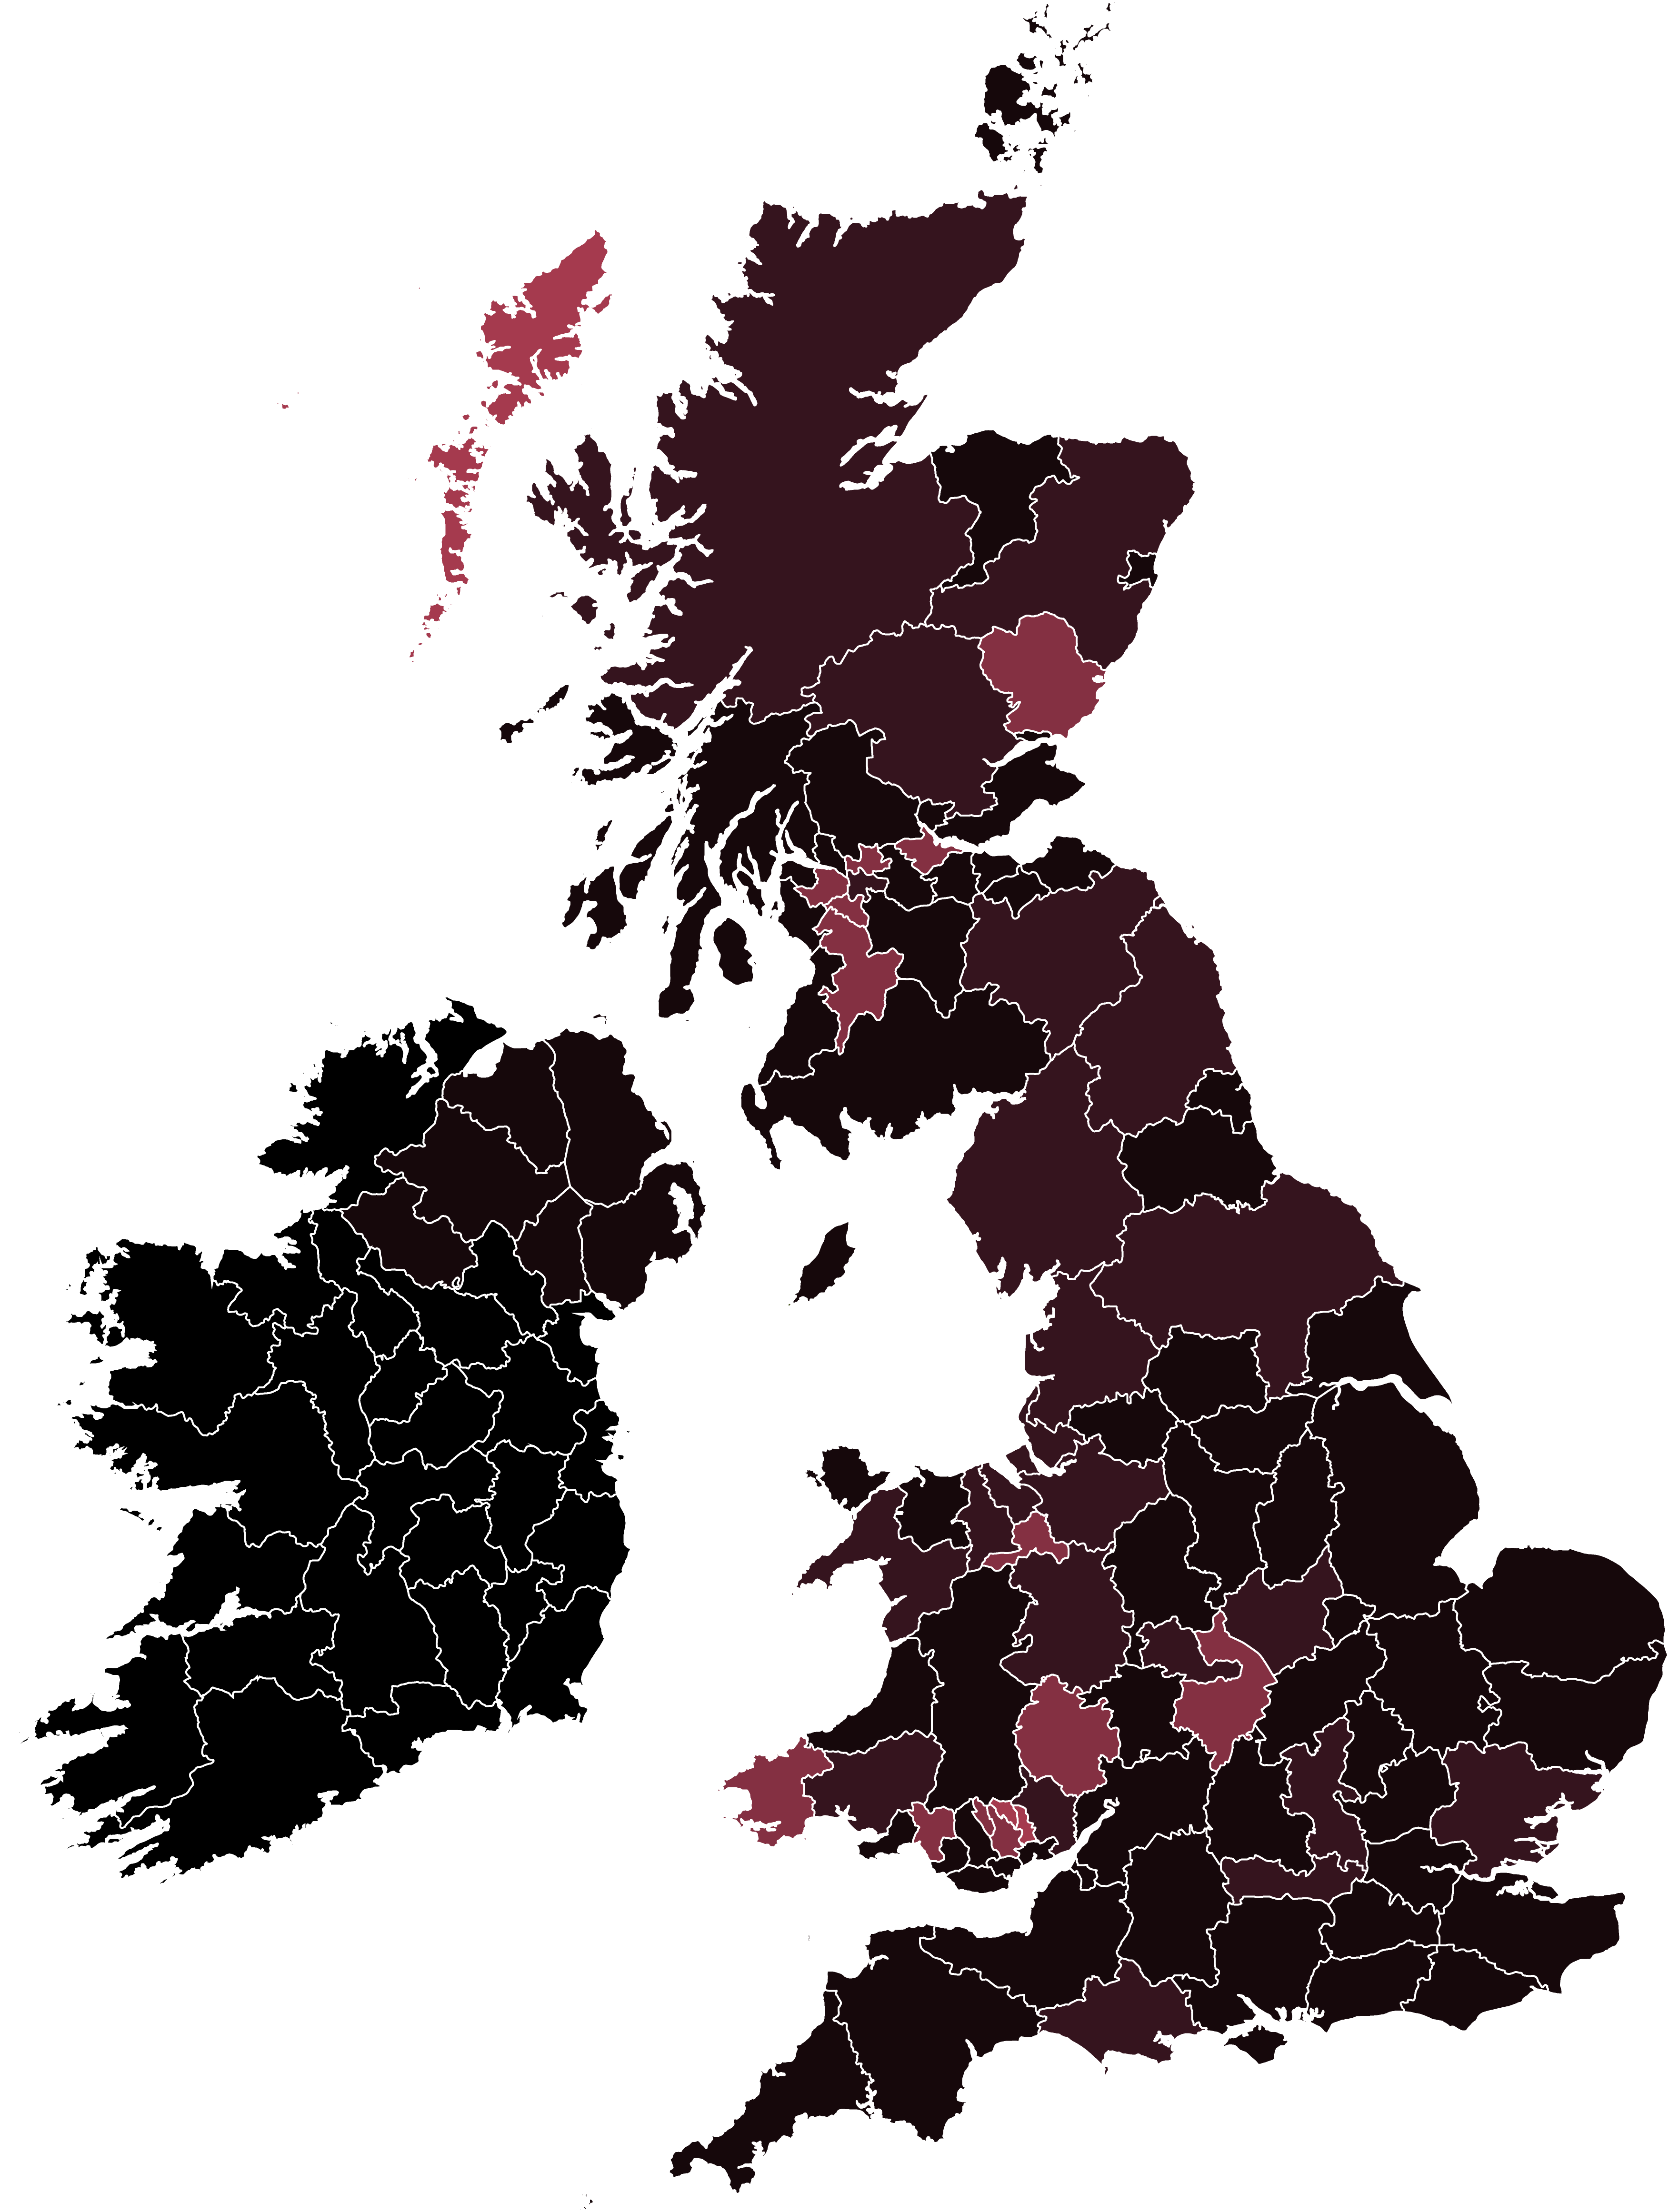
Our Annual Bullying Survey consistently finds that the rates and nature of bullying behaviors vary from region to region, due to factors such as population make-up, socioeconomics, access to quality education, and local culture. This data shows that these regional variations are equally apparent online.


In these graphics, the brightest red areas display a higher ratio of insensitive language to constructive debate; darker areas have more debate and comparatively less abusive language.
Please note: more sparsely populated areas are relatively low volume. Data of this kind should be interpreted with caution.
Nobody should be subjected to any type of bullying, harassment or abuse and we’re here for anybody who needs advice and support.
Click here to ask us a question and we’ll do our best to point you in the right direction.
DTL relies upon the support of people like you who believe in a world that is free from all types of bullying. On average it costs £3 to help us positively change the life of one young person. Please help us by donating to keep our services available to even more young people in need.
This research takes us a step closer to beating bullying once and for all.
We use data, science, and psychology to proactively prevent bullying from happening and to help those who are affected it. We provide a crucial and life-changing support line for thousands of young people every week through our pioneering digital support programs and campaigns.
This data will help us continue to innovate and improve the support that we provide across all of our markets; primarily the UK, USA and Mexico.
Find out more: Brandwatch.com
Existing customer?Log in to access your existing Falcon products and data via the login menu on the top right of the page.New customer?You'll find the former Falcon products under 'Social Media Management' if you go to 'Our Suite' in the navigation.
Brandwatch acquired Paladin in March 2022. It's now called Influence, which is part of Brandwatch's Social Media Management solution.Want to access your Paladin account?Use the login menu at the top right corner.