Analyzing six billion emojis
The Emoji Report 2017
We analyzed every emoji published on Twitter over the last two years.
10 Minute Read
Demo the technology behind this reportHow we use emojis
Using Brandwatch’s new emoji analysis, we collected and analyzed every emoji published on Twitter over the course of two years.
During this period we collected 6,400,278,100 (six billion) emojis.
On average 250 million emojis are posted online each month. The month with the highest volume of emoji use was in July 2016, seeing 293 million. This was partly due to the UK’s European Referendum. In fact, in the months during and following the referendum, negative emoji use grew by 3%.
“This groundbreaking study of over 6 billion emojis is a must-read for modern marketers. Considering that consumers are sharing 7-9 million emojis on a daily basis, brands simply can’t afford to ignore the findings of this study.” – Drew Neisser, Founder & CEO at Renegade
The most popular emojis
Here are the most used emojis on Twitter (click the right-hand arrow):
Top 20 most used emojis
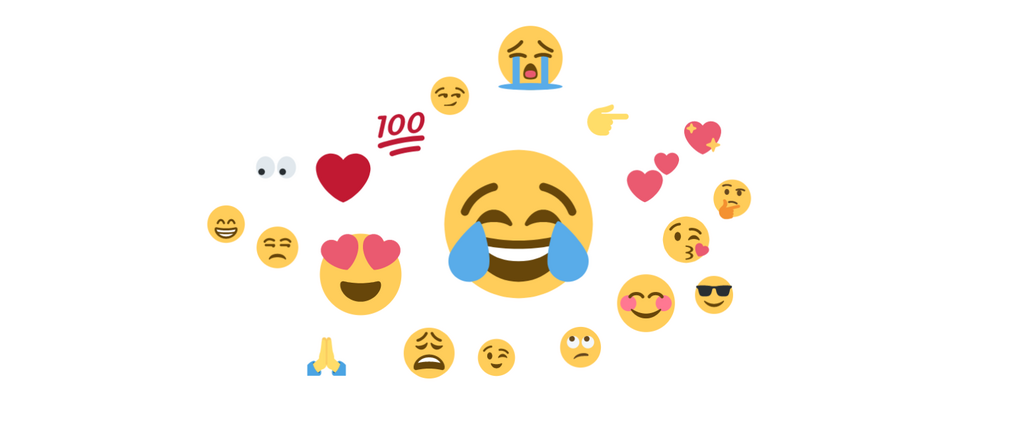
Top 50 most used emojis
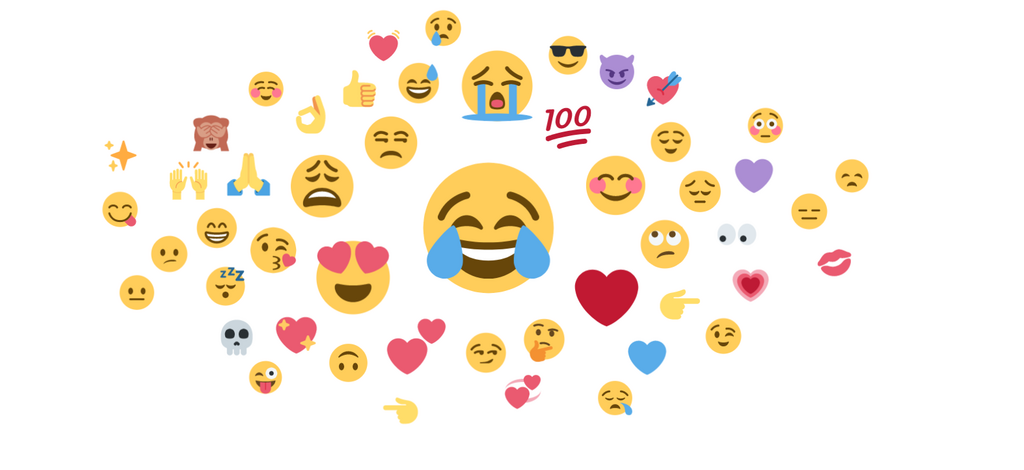
Top 100 most used emojis
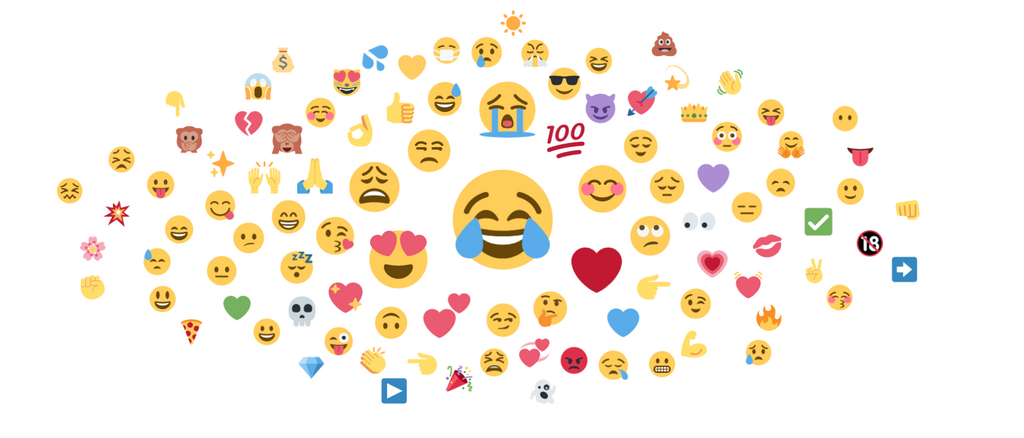
Top 150 most used emojis
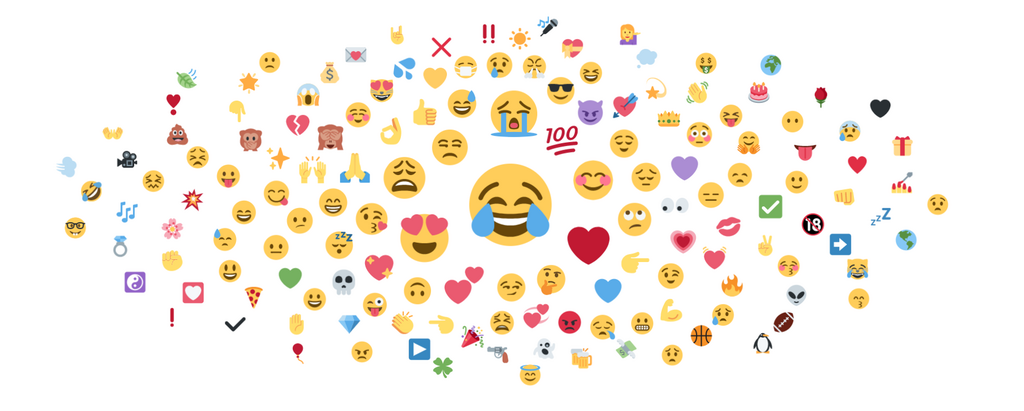
“Emojipedia notes that the most popular emojis at any given time are smileys, hearts, humans, and hand gestures. Even though there is a long list of animals, sports, objects, and symbols it seems that people want to see themselves or their emotions reflected in the emojis they use.” – Jeremy Burge, founder of Emojipedia and creator of World Emoji Day
Positive vs negative
Using Unicode’s official classifications, we were able to segment our data by positive and negative emojis.
Here’s how the volume of positive and negative emoji changes each month:
On average, 75% of the emojis on Twitter are positive and 25% are negative.
- Over the last two years, the use of negative emojis grew from 23.2% to 25.4% – an increase of 9.5% 😡
- The largest volume of negative emojis was recorded during the month of the American election (8th November 2016). During the week of the election, negative emoji use grew to 28.9% (a two year high) 😢
- Negative emoji use grew by 3% in the months before and during the British EU referendum (23rd June 2016) ☹️
- The highest percentage of positive emojis was recorded back in February 2016 (76.8%). This was partly due to hundreds of thousands of fans wishing @Harry_Styles a happy birthday 🎁
“In today’s digital landscape we can look at so much more than simple ASCHII to gain insights into customer behavior. Thankfully, the best of technologies help us to looks at things like emojis to understand how mindset and emotional state effects brands. This means richer insights, smarter engagement, and more relevance. You might even think of it as the dawning of Internet Emotional Intelligence”
This report from Brandwatch is quite possibly the most comprehensive report covering more than 6B tweets and giving us the richest look at social media and brand sentiment to date.” – Dennis Wakabayashi – VP, Digital Marketing and Commerce Integration @The Integer Group
Most used emotions
Using pre-built lists, we grouped emojis by emotion; joy, disgust, sadness, anger, fear, and surprise. For example, disgust included 😷 (face with medical mask) and 😩 (weary face), while anger included 😡 (pouting face) and 😤 (face with steam from nose). See methodology for full list.
This allowed us to see what type of emotion was displayed most on Twitter.
“It’s interesting to see the growth of the use of emojis during key events such as the US election. This gives us a great opportunity to understand, in real-time, the mood of an audience. That is powerful.” – Ian Cleary, Founder at RazorSocial
Emojis that represent joy (😃 😆 😊 etc.) lead the way with 31% of the total conversation, followed by:
- Disgust (😷 😖 😩 etc.)
- Sadness (💔 ☹️ 😢 etc.)
- Fear (😣 😨 💀 etc.)
- Surprise (😳 🙊 😅 etc.)
- Anger (😡 😤 😠 etc.).
This stat doesn’t reveal why one emoji is used over another, so to better understand the ‘why’, we measured emoji usage over time.
Here’s how the volume of each segment changed over two years (click the right-hand arrow):
Use of 'joy' emojis over time
Use of 'disgust' emojis over time
Use of 'sad' emojis over time
Use of 'anger' emojis over time
Use of 'fear' emojis over time
Use of 'surprised' emojis over time
All emotion segments combined
“While emoji use is continually increasing, the use of emojis that express emotion is decreasing. This is an indicator that object/place/action emoji (e.g., airplane, American flag, dancing lady) are responsible for the overall increase in emoji use. This is a trend that social analysts, brand managers, and crisis communicators must recognize. Smart professionals will equip themselves with software and expertise to not only find and analyze the context emoji provide to written language, but also incorporate that context into their outbound communications to connect with young, international audiences.” – Dr. Liz Gross, Director, Campus Sonar
Analyzing each graph revealed four unique insights:
- Fear emojis spiked to an all-time high in the run-up to the EU referendum. However, use of fear emojis dropped dramatically following the result 😨
- Sad emojis spiked to an all-time high in May 2017 due to the Manchester terrorist attacks
- Joy emojis spiked on Dec 25th, 2015 and 2016 due to Christmas 🎅🏻
- Anger emojis spiked on Aug 20th, with 33% of angry emoji tweets referencing Donald Trump 🤬
“Is there a season for joy? A season for despair? Apparently, there is, according to this new research.” – Mark Schaefer, Executive Director, Schaefer Marketing Solutions
When emojis are used
Do we use more angry emojis when we’re tired? Are we really happier on the weekend?
By analyzing the average positive and negative emoji usage by time of day, we attempted to answer these questions. This data looks specifically at tweets published in the UK:
Emoji use by time of day
In line with general Twitter conversation, emoji usage spikes at 9pm. However, negative emoji dramatically increases in the evening:
- The use of negative emojis averages at 22.5% during the day (6am to 8pm)
- However, during the evening (8pm to 6am) negative emoji use grew to 27.3% – an increase of 21% 🙌
In a similar light, the volume of positive emojis increases in the run-up to the weekend:
- The average usage of positive emojis on Friday and Saturday is 77.7% 📆
- On every other day, it’s 76.2% – a 1.9% decrease
How men and women use emojis
Using Brandwatch’s demographic analysis to determine each author’s gender, we were able to uncover how men and women use emojis differently (click the right-hand arrow):
Male vs. female emoji usage
Most used emojis by gender
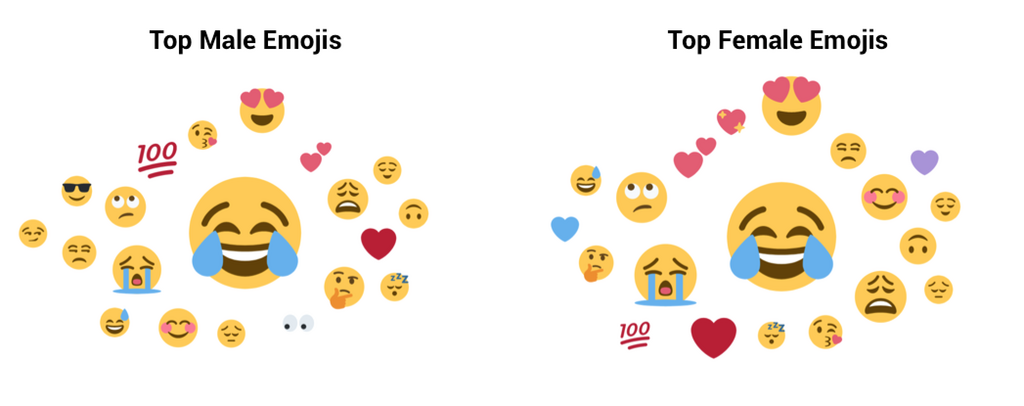
Perhaps surprisingly, there are some stark differences in how men and women use emojis.
For example, women are more likely to use emojis when tweeting and they’re 6.83% more likely to use negative emojis than men:
- Men are more likely to use 👀, 😎, 🤔, 😅, and 😏
- Women are more likely to use 🙄, ❤️, 😴, 🙃, and 💜
- Women are 11% more likely to use emojis that represent joy
- Men are 35% more likely to use emojis that represent fear
How people around the world use emojis
Emoji is an international language.
Everyone can communicate with them regardless of the language they speak.
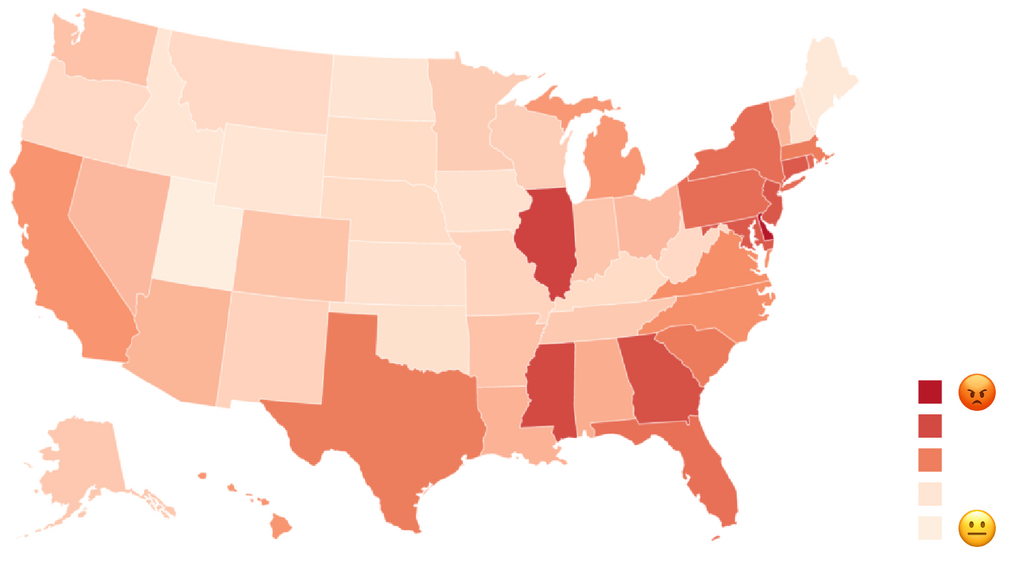
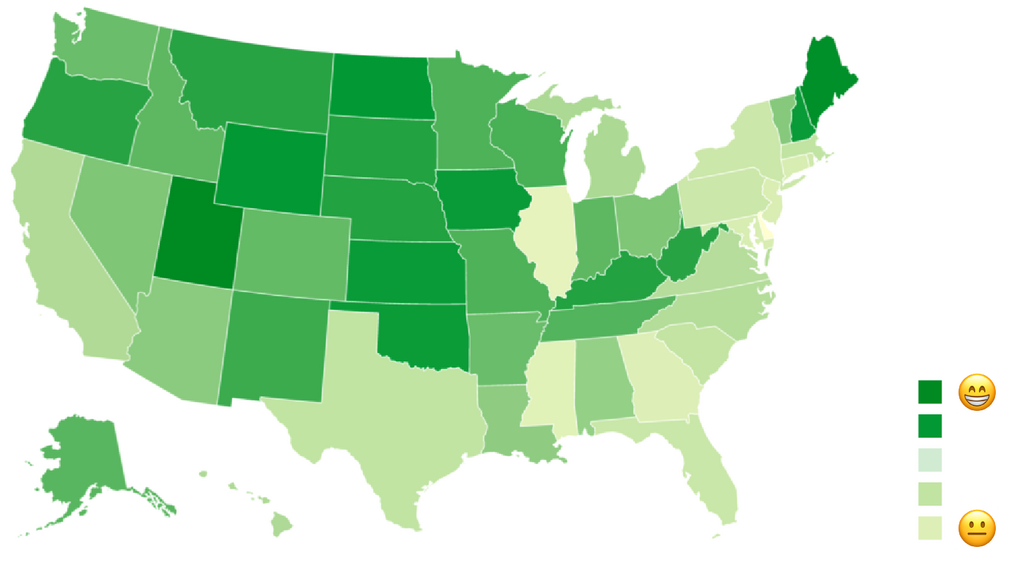
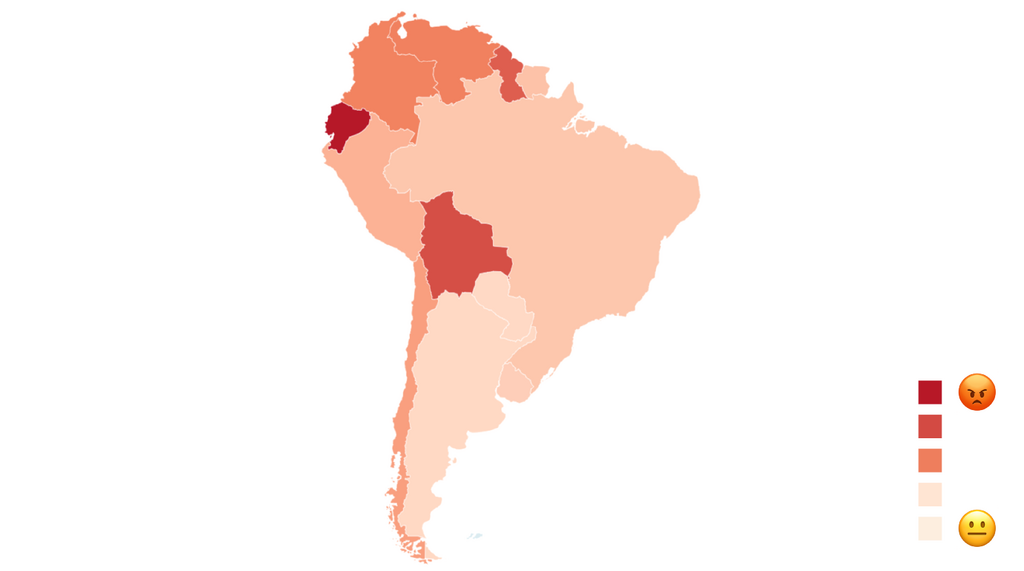
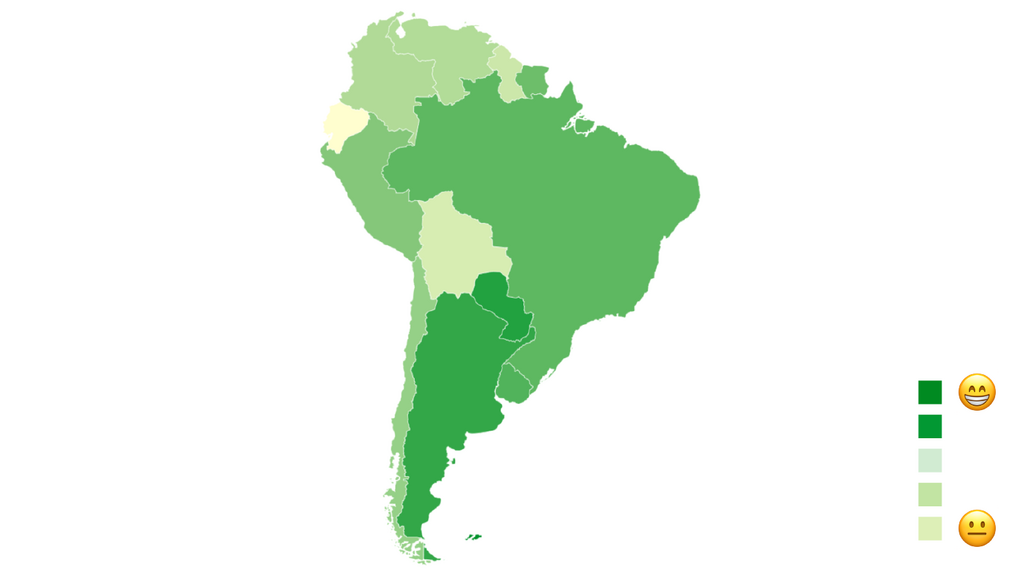
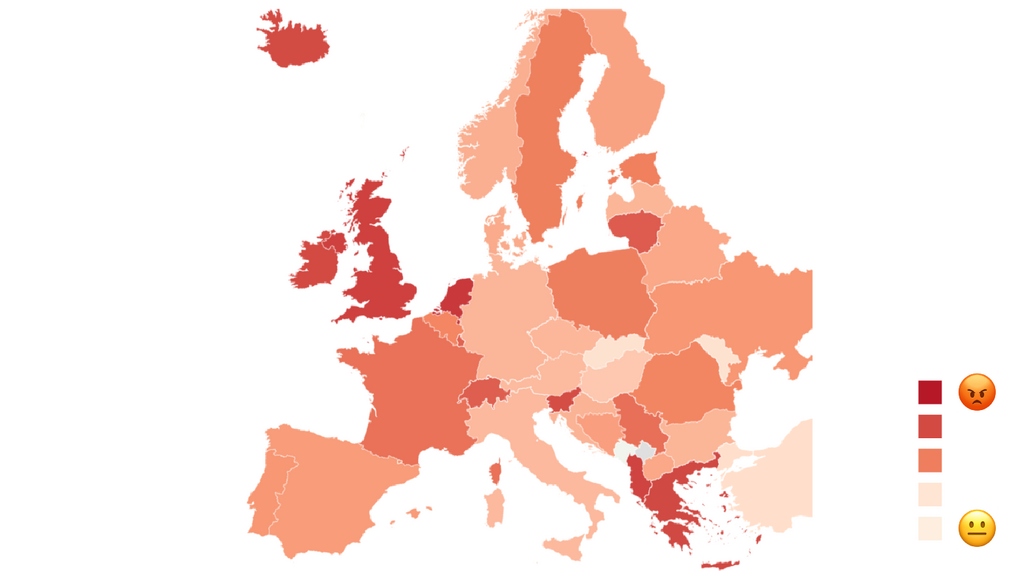
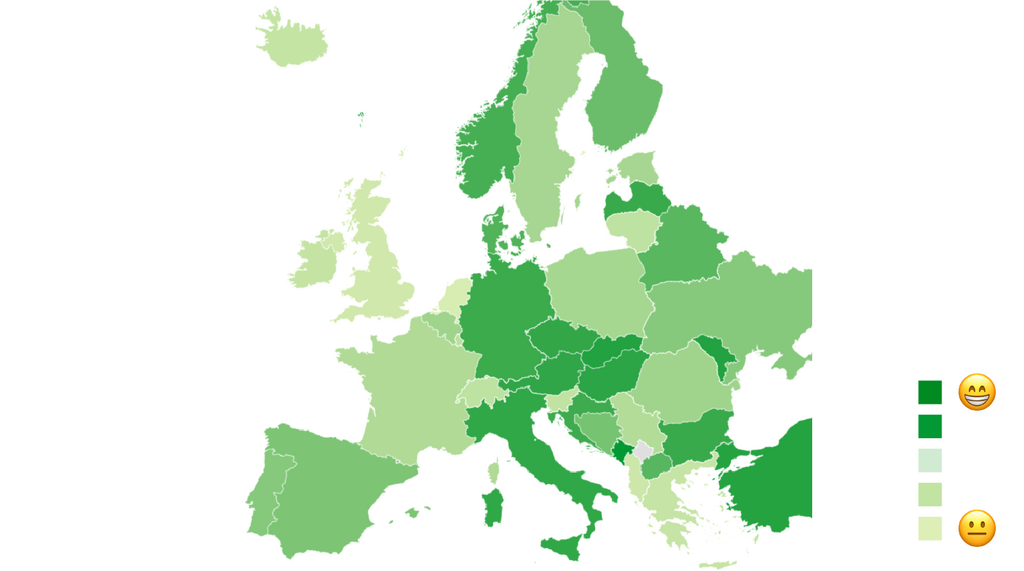
This gave us a unique opportunity to analyze how emoji usage changes throughout the world. The images below reveal the locations with the highest percentage of positive or negative emojis (click the right-hand arrow):
United States 🇺🇸
- The most positive states are Utah, Maine, and Wyoming
- The most negative states are Delaware, Illinois, and Mississippi
South America 🌎
- The most positive countries are Paraguay, Argentina, and Uruguay
- The most negative countries are Ecuador, Bolivia, and Venezuela
- Ecuador is the most negative country we analyzed. 34% of tweets including an emoji were negative 😡
Europe 🇪🇺
- The most positive countries are Montenegro, Monaco, and Gibraltar
- The most negative countries are Netherlands, United Kingdom, and Greece
- 85% of tweets from Vatican City are positive 😇
United Kingdom 🇬🇧
- The most negative city in the UK is Edinburgh
- The most positive city is Belfast
How consumers and brands use emojis
Since September 2015 the volume of tweets containing a brand name and an emoji has grown by 49%.
Brands are now much more likely to use emojis when communicating with their audience and consumers are more likely to use emojis when engaging with brands.
This got us thinking. Which brands generate the most positive emoji engagement on Twitter?
“Emojis are such a huge part of the way we communicate online; this incredibly in-depth guide can help brands better understand how their audiences are using emojis, but also how other brands are using them to their advantage – or disadvantage.” – Lilach Bullock, Content Marketing and Social Media Specialist
The most positive brands
Here are the top 50 brands sorted by the amount of tweets that included the brand name and a positive emoji (as a percentage of their total conversation):
The top 50 positive brands
| Rank | Brand | Percentage of Positive Emojis |
|---|---|---|
| 1 | Pantene | 93.9 |
| 2 | Jameson | 93 |
| 3 | Subway | 90.5 |
| 4 | InterContinental Hotels | 89.6 |
| 5 | Tesla | 87.6 |
| 6 | Unicef | 87.3 |
| 7 | Tommy Hilfiger | 87.2 |
| 8 | Aviva | 86.8 |
| 9 | Guinness | 86.3 |
| 10 | MasterCard | 86 |
| 11 | Mercedes-Benz | 85.3 |
| 12 | Sony | 85.1 |
| 13 | Four Seasons | 84.7 |
| 14 | Budweiser | 84.4 |
| 15 | Gatorade | 84.4 |
| 16 | Jagermeister | 84.4 |
| 17 | Nike | 84 |
| 18 | Foot Locker | 83.4 |
| 19 | Stella Artois | 83.1 |
| 20 | MTV | 82.9 |
| 21 | Evian | 82.8 |
| 22 | Target | 82.7 |
| 23 | AXA | 82.6 |
| 24 | CapitalOne | 81.9 |
| 25 | Macy's | 81.9 |
| 26 | NASA | 81.8 |
| 27 | Marriott | 81.4 |
| 28 | Hilton Hotels | 81.1 |
| 29 | Ford | 81.1 |
| 30 | Jack Daniel's | 81 |
| 31 | Heineken | 81 |
| 32 | Smirnoff | 80.8 |
| 33 | Premier Inn | 80.5 |
| 34 | Virgin Atlantic | 80.5 |
| 35 | Allianz | 80.2 |
| 36 | Gillette | 80.1 |
| 37 | Levi's | 79.7 |
| 38 | Marks and Spencer | 79.5 |
| 39 | Grey Goose | 79.5 |
| 40 | Shell | 79.4 |
| 41 | Audi | 79.3 |
| 42 | KLM | 78.6 |
| 43 | Chanel | 78 |
| 44 | Verizon | 77.8 |
| 45 | CIA | 77.6 |
| 46 | Samsung | 77.5 |
| 47 | Louis Vuitton | 77.1 |
| 48 | BP | 77.1 |
| 49 | T-Mobile | 76.5 |
| 50 | Fox | 75.9 |
- Pantene led the way mainly due to influencer engagement from Yuri and Selena Gomez 💅
- Jameson came in second partly due to a 10x increase in positive conversation during St Patrick’s Day 🥃
- Tommy Hilfiger performed well due to smart influencer engagement 😎
- InterContinental and several other hotels generate positive engagement due to user-generated content 🏨
These brands also performed well because they didn’t suffer from any major issues or crises during our analysis.
“We’re in a new age of visual sentiment mixed with a changing attention economy. Data on emojis by region can give us powerful insights on how consumers are feeling about a specific brand. The ability to segment this further by sentiment over time would help track what other issues may be affecting trends such as new product offerings, politics or other news events. Ultimately, it would help us identify where we need to improve consumer engagement.” – Ken Buraker, Executive Creative Director at Ketchum
To truly understand how each brand performs we’ve analyzed positive and negative emojis for each brand in 20 major industries (click the right-hand arrow):
Most positive and negative emojis for airline brands
“Social Intelligence has evolved from just keywords to encompassing several kinds of communication. Words, emojis, images, being able to analyze it all helps us get a better picture of our audience’s moods, attitudes, opinions and their view on a brand’s actions or reputation. We must never forget to cover all these different kind of angles when using social intelligence for our brand”. – Luis Fernando Martinez Funes, Digital Director at Llorente & Cuenca
The most positive and negative industries
By grouping several brands by industry we were able to determine which industries generate positive and negative consumer engagements:
Most positive and negative industries
| Rank | Industry | Positive Emojis | Negative Emojis |
|---|---|---|---|
| 1 | Hotels | 82.5 | 17.5 |
| 2 | Apparel | 81.3 | 18.7 |
| 3 | Spirits | 81.2 | 18.8 |
| 4 | Beer | 79.6 | 20.4 |
| 5 | Technology | 76.7 | 23.3 |
| 6 | Automotive | 76.3 | 23.7 |
| 7 | CPG | 76 | 24 |
| 8 | Soft Drinks | 75.1 | 24.9 |
| 9 | Fashion | 74 | 26 |
| 10 | Fast Food | 73.5 | 26.5 |
| 11 | Department Stores | 73.3 | 26.7 |
| 12 | Telecoms | 72.9 | 27.1 |
| 13 | Television | 72.5 | 27.5 |
| 14 | Payment Cards | 71.8 | 28.2 |
| 15 | Non-Profit | 70.5 | 29.5 |
| 16 | Energy | 70 | 30 |
| 17 | Airlines | 69.9 | 30.1 |
| 18 | Public Sector | 69.4 | 30.5 |
| 19 | Insurance | 68.2 | 31.8 |
| 20 | Consumer Banks | 64.5 | 35.5 |
- 🏨 Hotels lead the way due to reward schemes, positive customer experiences, and great customer service
- 🏦 Consumer banks come in last, due to a huge volume of consumer complaints
- ✈️ Airlines also perform badly due to missed connections, lost luggage, poor booking experience, and canceled flights
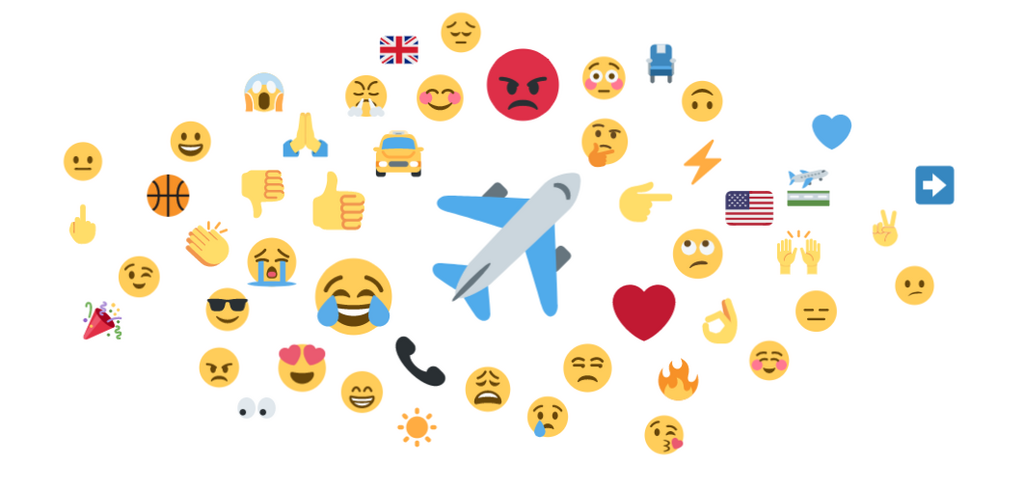
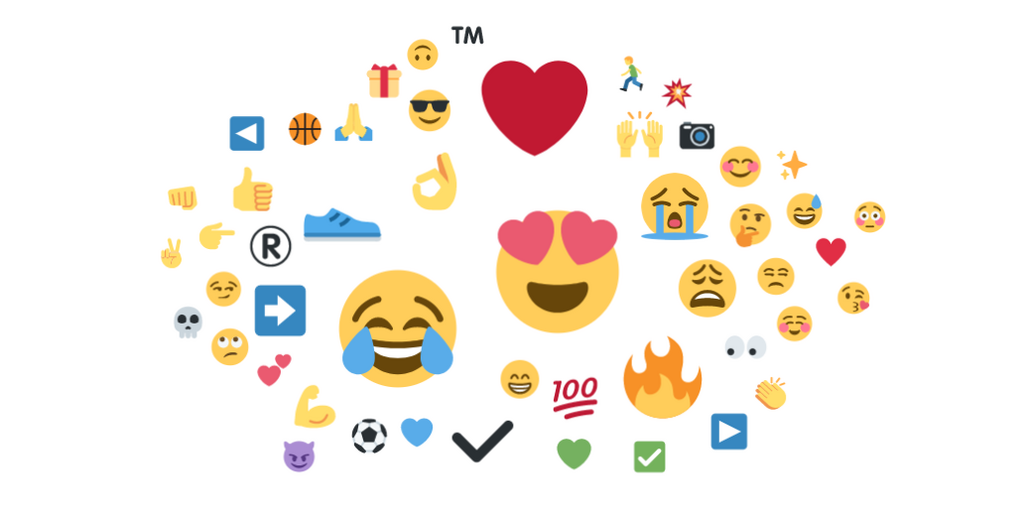
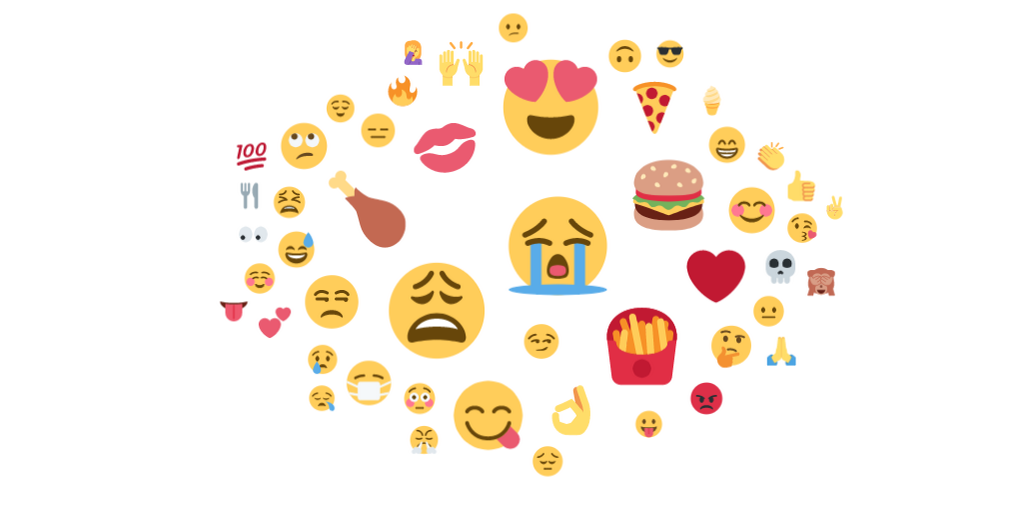
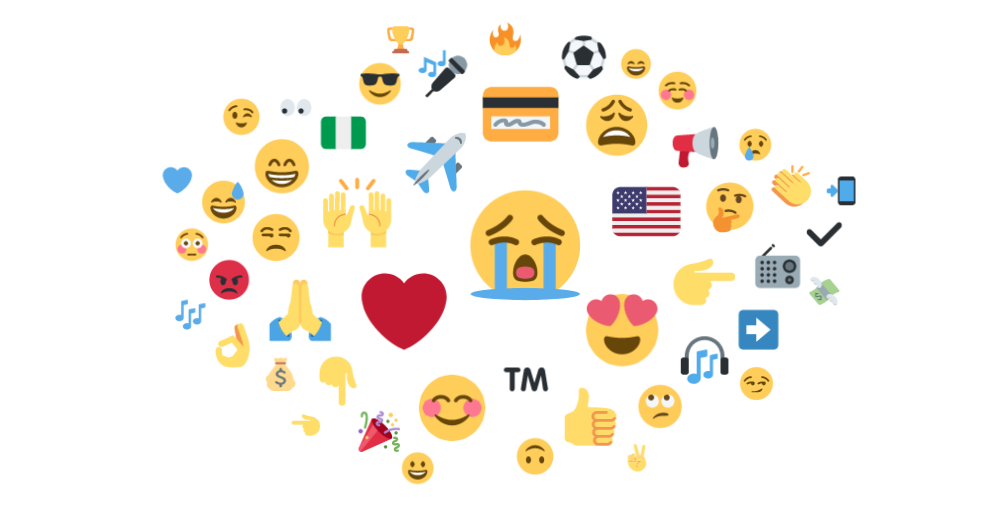
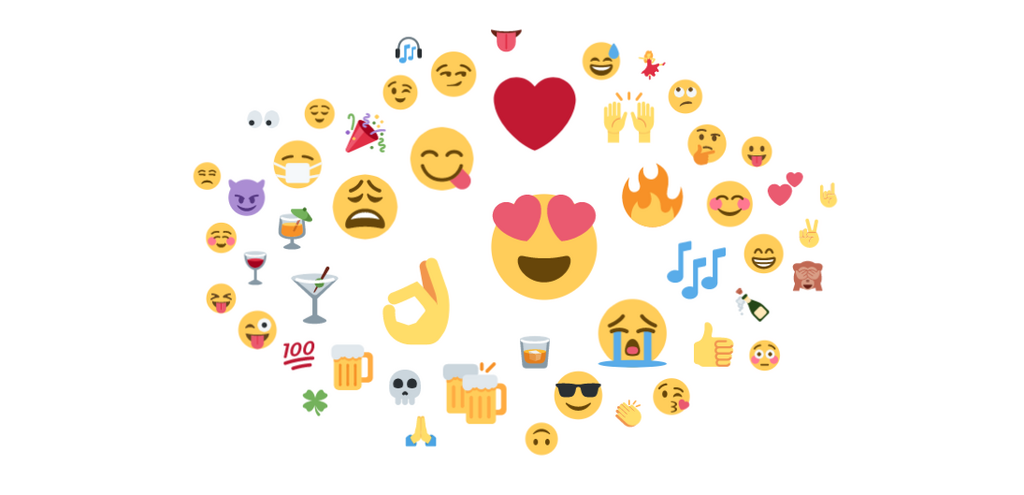
To understand what types of emojis fuel this sentiment, here are the most used emojis for some key industries (click the right-hand arrow):
Most used emojis for airline brands
Most used emojis for apparel brands
Most used emojis for fast food brands
Most used emojis for payment card brands
Most used emojis for spirit brands
Summary
Emojis are perceived by many as just a novel way to communicate, and most of us underestimate the value of them.
In less than 10 years the volume and variety of emojis have skyrocketed. Today, 95% humans online have used emojis, making it the internet’s most popular language.
It’s clear from this analysis that the volume of emojis will only continue to grow and increase in importance – we’ve seen the variety of emoji grow, and with the total number of emojis expanding to almost 3,000. As such, more and more emojis will start to replace everyday words and phrases.
This makes the analysis of emoji usage online a vital activity. Brands, organizations, governments, and others can uncover genuine insights in monitoring emojis on a macro scale. Whether it’s assessing brand health against the industry average, or emotion by location.
Brands, in particular, are set to garner the most value from emoji analysis as it provides a real-time look at how their brand, products, and services are perceived online compared to their competitors.
That’s today, but it wouldn’t require much effort to imagine a world in the near future where the volume of positive or negative emojis next to a brand name could be used to help determine a company’s market cap. Or a world where a 100% increase in emojis that represent illness help identify potential health issues across geographies.
With that in mind, here are four predictions 🔮:
- Emojis will cement its position as the only language that allows us to communicate with anyone globally
- The type of emojis available online will continue to diversify (e.g. Animojis and Bitmojis)
- Because of this, emojis will start to replace text as the key provider of context in future conversations
- Brands, organizations, and governments will analyze the use of emojis on a macro scale in real-time.
Expert Conclusions
Timothy Hughes
“We now live in an attention economy through social media. Brands want my attention and I want brands attention all through the lens of a mobile phone. It’s getting faster and shorter and anything that can save me time (and money).
Enter the Emoji stage left. Love them or hate them, they are a more efficient way of communicating. How much time has the ‘thumbs up’ emoji saved us all? This report proves they are not going away … but could I have written this all in emoji? Not yet, but it’s a matter of time.” – Timothy Hughes, CEO and Co-Founder at Social Experts
Bernado Donkor
“Gone are the days of solely relying on text for social listening. People won’t talk about your brand using just text – pictures, videos, GIFs, links to external resources, and yes, emoji too. Sure, this report has lots of interesting stats, but the message this drives home is that if you’re still only relying on textual search, you’re missing out on a big chunk of the conversation.
Gone are the days of expecting people to talk about your brand, your products, your services, in the language that you use internally at work – and gone are the days where using tools with the same mentality was enough. So, sure, check out the top emoji, and check out if you’ve made it on the list of most positively mentioned brands, and check out which industries are more positively or negatively mentioned – but once you’ve done all that, ask yourself – does your social listening tool help you get to the bottom of this for your own brand? If the answer is no, take that as your homework for the year.” – Bernado Donkor, Social Intelligence Lead at Microsoft
Marsha Collier
“Reading the report confirms that people today appreciate an extended way to express themselves. Emoji can express a thought without words and judicious use of emoji can enhance communication. This works well in person to person communications, or in marketing. They can paint a subtle, unmentioned emotion as part of a brand.” – Marsha Collier, Author
Pratik Dholakiya
“It’s interesting to note that the emojis representing known emotions: joy, disgust, sadness, fear, surprise, and anger, have all seen a decline in use from 2015 through 2017. Since it’s unlikely that this has anything to do with a drop in the total number of emojis used, this suggests that as more emojis have been introduced, a wider variety of emojis are being used to communicate a greater variety of things. We now have emojis to represent nouns and verbs, and a more creative use of emojis, or at least a use more in line with trends and memes, is taking precedence.
Brands that make use of emojis need to be aware that they have become a part of the lexicon. Incorporating them to appear trendy or cutting edge is likely to backfire, but using them to clear away any confusion about the emotional intent of a message is more likely to resonate.
The wide use of emojis by the male population should also be interpreted as a warning to brands to be careful with emojis. If you aren’t familiar with these symbols, they are most widely used in ironic “copypaste” memes, and brands who fail to understand the proper context are likely to find themselves the butt of the joke in discussions such as those that take place on Reddit’s “fellow kids” subreddit. Care should be taken if brands hope to avoid being seen as the “try-hard” dad in the room, and knowledge of the target audience is essential.” – Pratik Dholakiya, Co-Founder E2M
Viveka von Rosen
“As an avid and active user on LinkedIn, I am beginning to see more and more people use emojis in their profile – particularly in their Professional Headlines, Summary and Experience sections as well as in updates.
When using emojis on LinkedIn I’d like to offer this word of warning: know your audience. You don’t want to turn off a corporate enterprise B2B prospect by being too cute. Having said that, this report shows not only the overall increase of emojis’ on digital, but that there has been an increase in the use of Emojis by B2B companies as well (see section 2). So perhaps some use of emojis and icons can draw attention to your purple, and help align you with a new audience while adding some positive sentiment to your content.” – Viveka von Rosen, Chief Visibility Officer & Co-founder at Vengreso
Heidi Cohen
“Interestingly, although positive emojis outweigh negative ones, analysis of emoji emotions show almost 3/5s are negative (specifically disgust, sadness, anger, and fear). Through their communication of emotions, it’s no surprise that women use emojis more frequently than men. While emojis appear to be aligned with politics and news the overall inflection points aren’t that large.
On a macro level, this emoji analysis reveals a trend towards communications similar to earlier Egyptian hieroglyphics. More than becoming a global language, emojis represent a breakdown of existing communications into simplified visuals which are faster to consume and use.” – Heidi Cohen, Chief Content Officer – Actionable Marketing Guide
Evan Dunn
“Businesses cannot put too much stock in analyzing emoji, but also they cannot discount the importance of it.
Here’s what I mean: When I was in Middle School, everyone walked around obnoxiously saying “WAZZAAAAAAP!” There was no point to this. It was not charming. It was insider trading with language. Businesses interact with real people who say weird things, strange things, seemingly unimportant things.
The implications of this behavior for business are actually surprisingly tangible: 1) Imagine creating an ad campaign using emoji. You need to know the lingo to use the lingo, and you need to know which lingo is relevant to your business. Check out Brandwatch’s findings on different emoji by vertical. 2) Imagine boosting employee morale with “Here’s the top face Twitter makes when people talk about us!” (As long as it’s a positive emoji). Again with Brandwatch’s vertical-specific findings. 3) Imagine trying to describe your business with emoji to your customer – wouldn’t it be fun? It’d make a good social campaign. All of these examples are very social in their channel focus – social media, social behavior. But that’s because we’re talking about a very communal facet of the way people talk. It’s social.” Evan Dunn, Director of Expert Services, Transform
Ron Sela
“Emotions play a big part in the decision making of consumers. Consumers respond emotionally to an ad instead of paying attention to the details of its content, therefore, significantly influencing their decision-making abilities. This is precisely why manufacturers are making a significant profit on creating advertisements that pull at the heartstrings of their consumers.
Emotional posts on social media sites help to shape the customers overall point of view of a company, triggering something deep inside that influences the decisions they make. When consumers share on social media, they are seeking happiness. In fact, most of the top drivers containing viral content are related to gleefulness.
To evoke this response from consumers, many businesses are using emojis to enhance their company’s image. Using emojis creates a positive atmosphere that is associated with happy customers, therefore, encouraging others to utilize the services provided by the company.” – Ron Sela, Growth Marketing Advisor at Ron Sela Consulting
Doug Kessler
“This amazing research made me ??, ? and ?. This is the first analysis of a huge change in the way people use language. And it’s fascinating. Major ?? to the team behind it.” – Doug Kessler, Creative Director & Co-founder of Velocity
Methodology
Scope
In this report, we analyzed how emojis were used online using the world’s leading social listening platform, Brandwatch Analytics. Specifically, we looked at general emoji use by analyzing every emoji published on Twitter, and consumer emoji use by analyzing emojis published near a brand name. This provided social benchmarks that could help inform any organization or industry using or invested in social media, and help provide unique insight into how the emoji language is used. In order to achieve this, we analyzed a statistically accurate 10% sample of Twitter within a two-year time period from Sept 1st 2015 – Sept 30th 2017.
Brandwatch Analysis
Gender, Interests & Profession: Gender, Interests, & Profession are evaluated learning user account or profile information as well as machine-learning techniques.
Rules & Categories: Brandwatch’s rules, which rely on Boolean logic, allow users to separate specific conversations into specific categories. Rules can be understood as “queries within queries.”
Emoji Detection: Brandwatch can pick up usage of emoji published by any operating system.
Sampling: A statistically accurate 10% sample was used to collect the data. This sample was extrapolated by 10x in the report to give an accurate estimate of what the full coverage would be.
Brand selection
The Emoji Report analyzed 100 brands in total. The 100 brands were selected through two processes. First, we examined revenue and output lists, industry literature, and social data to compile a list, then we cross-referenced with well-known brand ranks like the Fortune 500 and the Interbrand Best Global Brands.
Determining positive and negative emojis
To determine positive and negative emoji we used Unicode’s official positive and negative classifications. Unicode only classifies faces as positive and negative, so emojis like this ❤️ won’t be classified as positive and emojis like this 💔 won’t be classified as negative. Despite that our results revealed a high precision rate, so we felt happy to display the analysis. For the emotion classification, our internal research team used DeepMoji’s open API to pull a list of emotion segmented emoji. The full list of segments can be found here.